November 14, 2014 | by Katie Claflin
Categories: Affordable Housing
According to the U.S. Department of Housing and Urban Development, housing is considered to be affordable if it costs less than 30% of a household’s monthly budget.
This traditional affordability indicator does not consider transportation costs, which can be very substantial for households that live far from work or other daily responsibilities and do not have easy public transportation options.
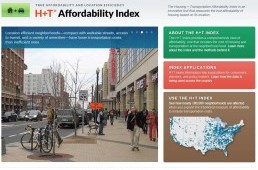
The Center for Neighborhood Technology has created the H+T Index to help residents, policy makers and other stakeholders determine how affordable their communities are, based on both housing and transportation costs. Transportation costs include the costs to own, maintain, and insure a car (if one is needed to perform daily responsibilities); the cost of gas; and public transportation costs.
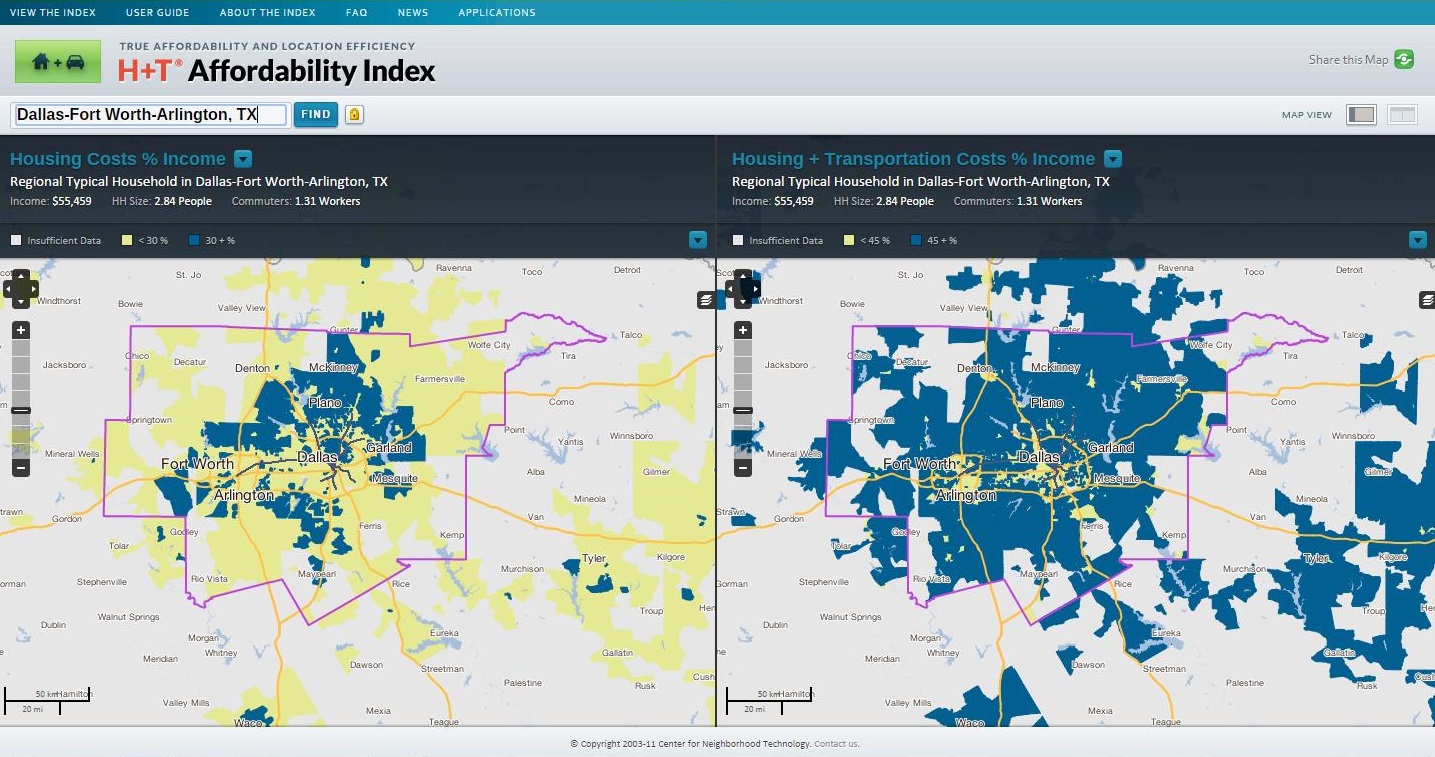
Using the traditional measure of housing affordability (< 30% of household budget), the Index shows that 76% of American neighborhoods are affordable for the typical American household. However, the affordability landscape changes dramatically when both housing and transportation costs are considered. When setting the housing plus transportation affordability benchmark at 45% of a household’s monthly budget, the Index finds that the percentage of affordable American neighborhoods drops to 28%.
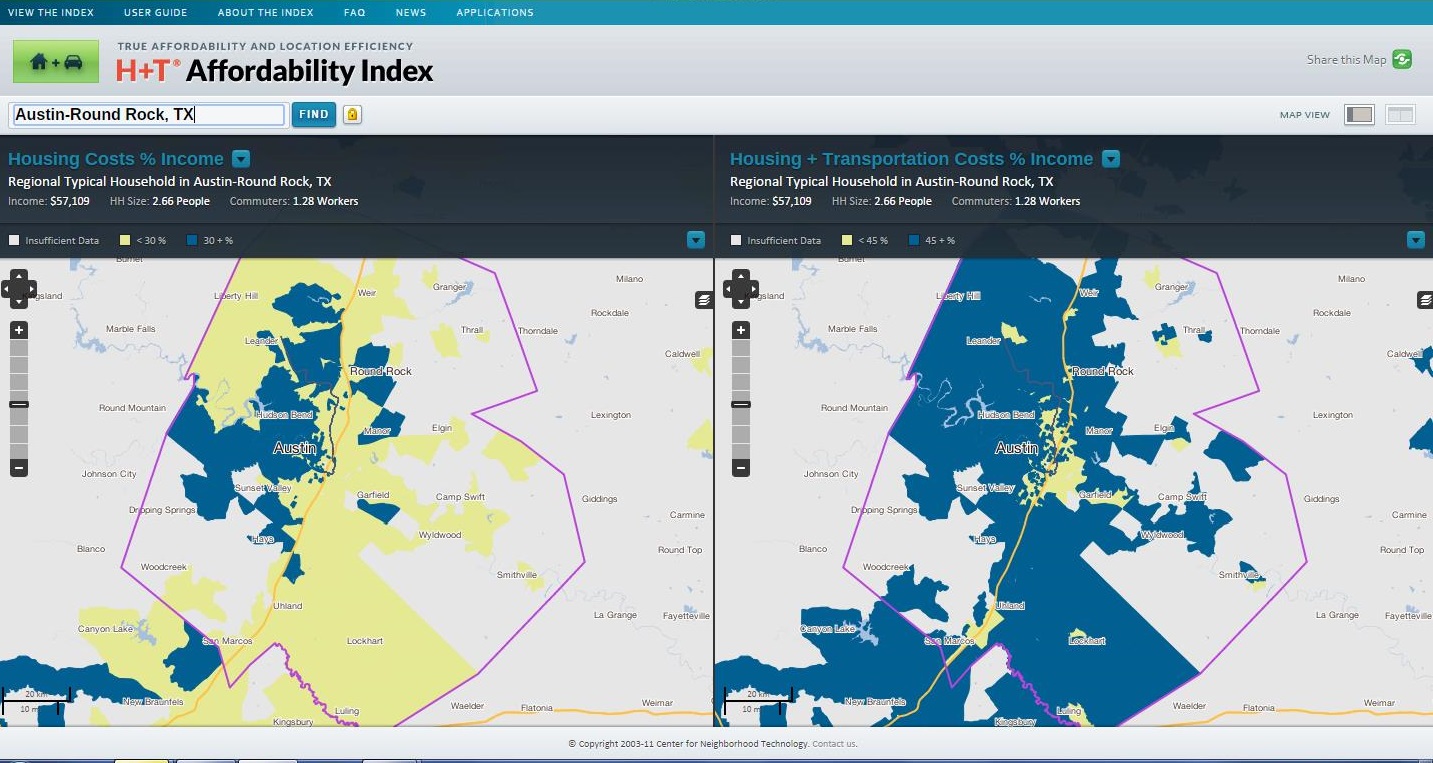
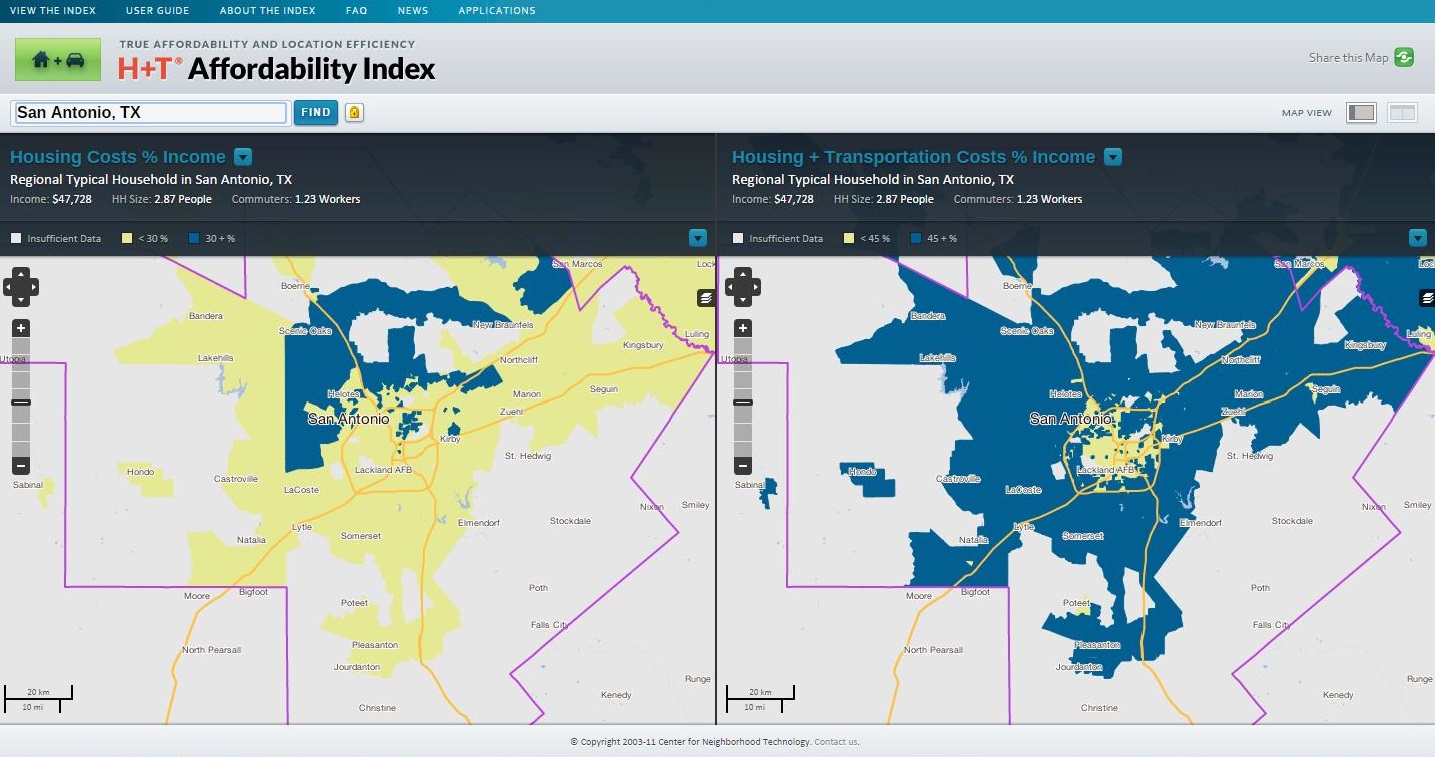
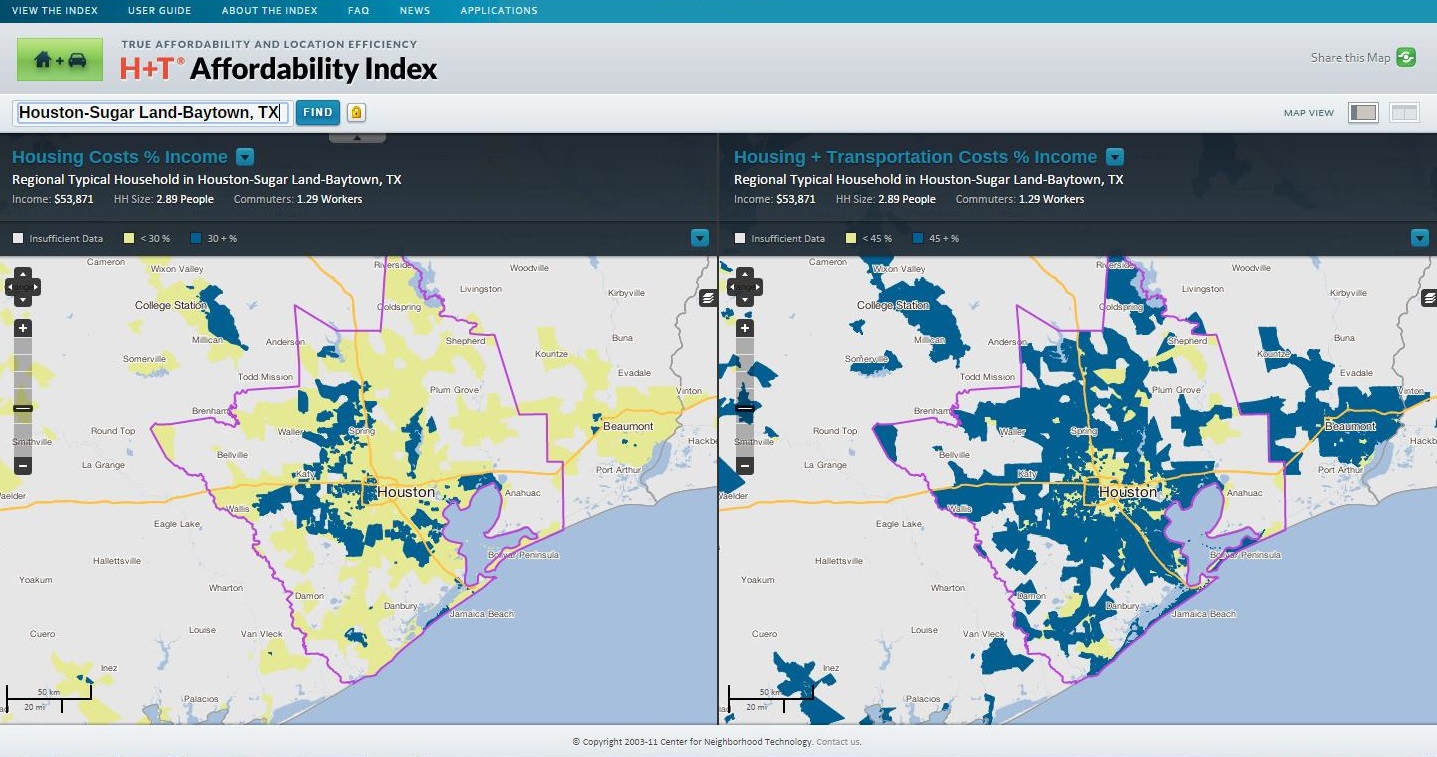
Below you will find affordability snapshots of some of Texas’ largest and fastest growing cities: Austin, San Antonio, Houston and Dallas/ Fort Worth. The snapshots show side-by-side comparisons of housing costs as a percentage of area median income (left map) and housing plus transportation costs as a percentage of area median family income (right map).
Using the housing and housing plus transportation affordability benchmarks discussed above, the yellow areas are considered affordable, whereas the blue areas are considered unaffordable.
The H+T Index includes affordability data, maps, charts and statistics for over 900 metropolitan and micropolitan areas throughout the United States-- covering 89% of the population. Click here to view affordability statistics for your community.
The index also allows users to customize their comparisions, which includes providing side by side maps comparing different geographic areas.
On the House blog posts are meant to provide general information on various housing-related issues, research and programs. We are not liable for any errors or inaccuracies in the information provided by blog sources. Furthermore, this blog is not legal advice and should not be used as a substitute for legal advice from a licensed professional attorney.
TSAHC reviews all blog comments before they are posted to ensure a positive experience for our online community. Off-topic comments; hostile, derogatory or deliberately insulting comments; and comments specifically promoting goods and services will not be posted.
Approved comments will be published in their entirety. Personal information will not be removed unless it pertains to someone other than the person submitting the comment. For more information, please see our Comment Posting Guidelines.
To remove a previously submitted and published comment, please contact Anna Orendain at [email protected].
If you have a question regarding any of TSAHC's programs, please contact us.

H+T Index - useful tool - thanks for calling it to our attention.